メッシュデータの扱い#
\(z(x,y)\) のような形式で,\(x\), \(y\)が等間隔のメッシュで与えられているデータを可視化してみます. ここでは比較のためにmatplotlibも使います.
import pygmt
import numpy as np
import matplotlib.pyplot as plt
等間隔メッシュデータ#
まず,サンプルとして NumPy で適当な等間隔データを作成してみます.
nx = 300
ny = 200
x = np.linspace(0, 3, nx+1)
y = np.linspace(0, 2, ny+1)
z = np.zeros([ny+1,nx+1])

for i in range(nx):
    for j in range(ny):
        a = np.pi * ( x[i]    - np.sqrt(3.0) * y[j] )
        b = np.pi * ( 3.*x[i] + np.sqrt(3.0) * y[j] )
        z[j,i] = np.cos(2*a) * np.cos(4*b) + np.cos(5*a) * np.cos(3*b) + np.cos(7*a) * np.cos(b)
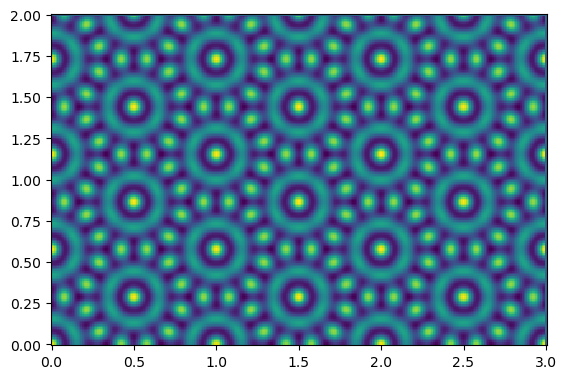
試しにmatplotlibでプロットしてみると,以下のような感じです.
g = plt.subplot()
g.pcolormesh(x, y, z, shading='auto')
g.set_aspect('equal')
このデータを pygmt の xyz2grd を用いて grdデータにしてプロットしてみます.
Note
xyz2grd はx, y, zそれぞれ1次元配列にしないと渡せないようです.そのため,np.meshgrid()と ravel() メソッドを通じて nx * ny サイズの1次元配列を作っています.
もうすこしスッキリした書き方としては,x, y, zの代わりにそれらがパッキングされたdataリストを内包表記を用いて与える方法もあります:
pygmt.xyz2grd(
    data = [[x[i], y[j], z[i,j]] for i in range(len(x)) for j in range(len(y))]
    # 他の要素は省略
    )
さらに発展的な方法として,xarray モジュールを用いて,以下のように表現することもできます.
import xarray as xr
grddata = xr.DataArray(
    data = z,
    dims = ["y", "x"],
    coords = {"y": y, "x": x}
)
この方法は高速なだけでなく,PyGMTがグリッドデータのPython内部オブジェクトとしてxarrayを用いている点からもより直接的で好ましい方法と思われます.xyz2grdモジュールとことなり,わざわざxy方向のグリッド間隔を明示的に指定する必要がないのも好ましい点です.
fig = pygmt.Figure()

X, Y = np.meshgrid(x, y)

grddata = pygmt.xyz2grd(
    region = [0, 3, 0, 2],
    spacing = '0.01/0.01',
    x = X.ravel(),
    y = Y.ravel(),
    z = z.ravel()
)

pygmt.makecpt(
    cmap       = 'viridis',     # 比較のためカラーパレットはほとんど同じものを使う
    series     = [-3, 3, 1],
    continuous = True
)

fig.grdimage(
    grid       = grddata,
    projection = 'X9c/6c',
    frame      = ['WSen', 'xaf+lx', 'yaf+ly'],
)

fig.grdcontour(
    grid     = grddata,
    levels   = 1,
    pen      = 'default,black'
)

fig.colorbar(
    position = '+e'
)

fig.show()
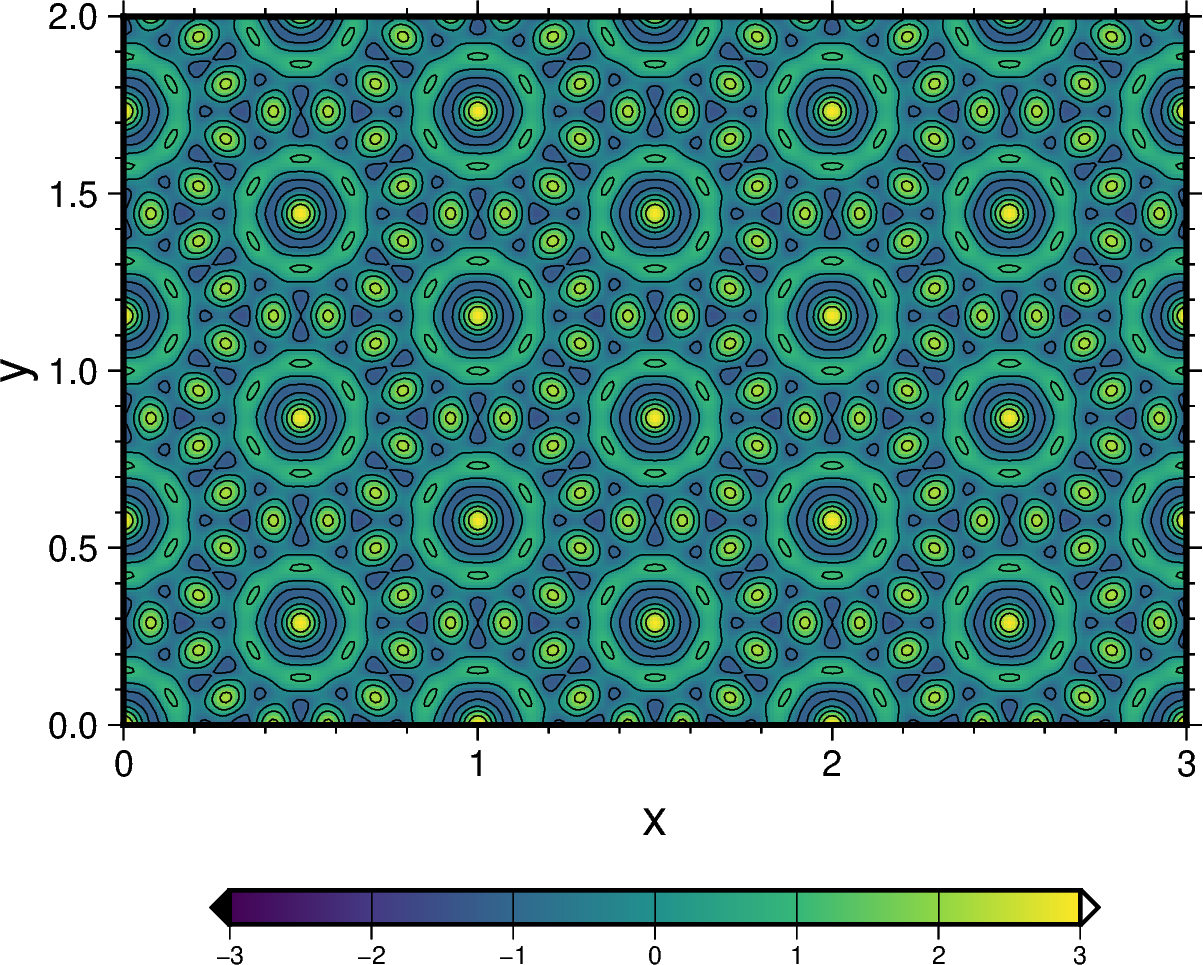
ここでは,grdimageのほかにgrdcontourも用いて等値線も描画してみました.使い方は上記の例を見ればほとんど明らかだと思います.
Note
grdcontour で等値線の間隔を指定するオプションは,従来は intervals でしたが,v0.12.0 からは levels に変更されました.
2次元データの補間と可視化#
続いて,粗いデータを補間しつつプロットしてみましょう.
サンプルデータとして,Wikipediaの双3次補間の解説にある例を採用します.ここからコードをお借りして(Creditはリンク先参照;CC-BY),以下のようなデータを使います.まずはデータ生成とmatplolibでの標準的可視化の例を示します.
METHODS = [ 'nearest', 'bilinear' ]
COLORS  = 'viridis'

N = 5
np.random.seed(1)
grid = np.arange(0, N, 1)
data = np.round(np.random.rand(N, N), 1)
mesh = np.meshgrid(grid, grid)

for interp in METHODS:

    fig = plt.figure(figsize=(5,5))

    ax = fig.add_axes([0.125, 0.175, 0.75, 0.75])
    plt.imshow(data, interpolation=interp, cmap=COLORS, vmin=0, vmax=1)
    plt.plot(mesh[0], mesh[1], marker='.', ms=8, color='k', lw=0)
    plt.title(interp, weight='bold')
    plt.xlim(grid.min()-0.5, grid.max()+0.5)
    plt.ylim(grid.min()-0.5, grid.max()+0.5)
    plt.xticks(grid)
    plt.yticks(grid)

    cax = fig.add_axes([0.125, 0.075, 0.75, 0.03])
    cb = plt.colorbar(cax=cax, orientation='horizontal',
                      ticks=np.linspace(0, 1, 6))
    cb.solids.set_edgecolor('face')
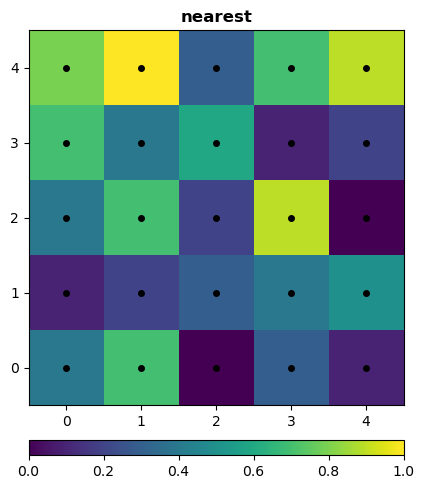
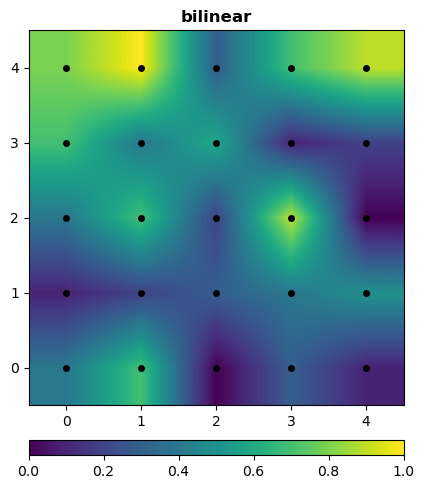
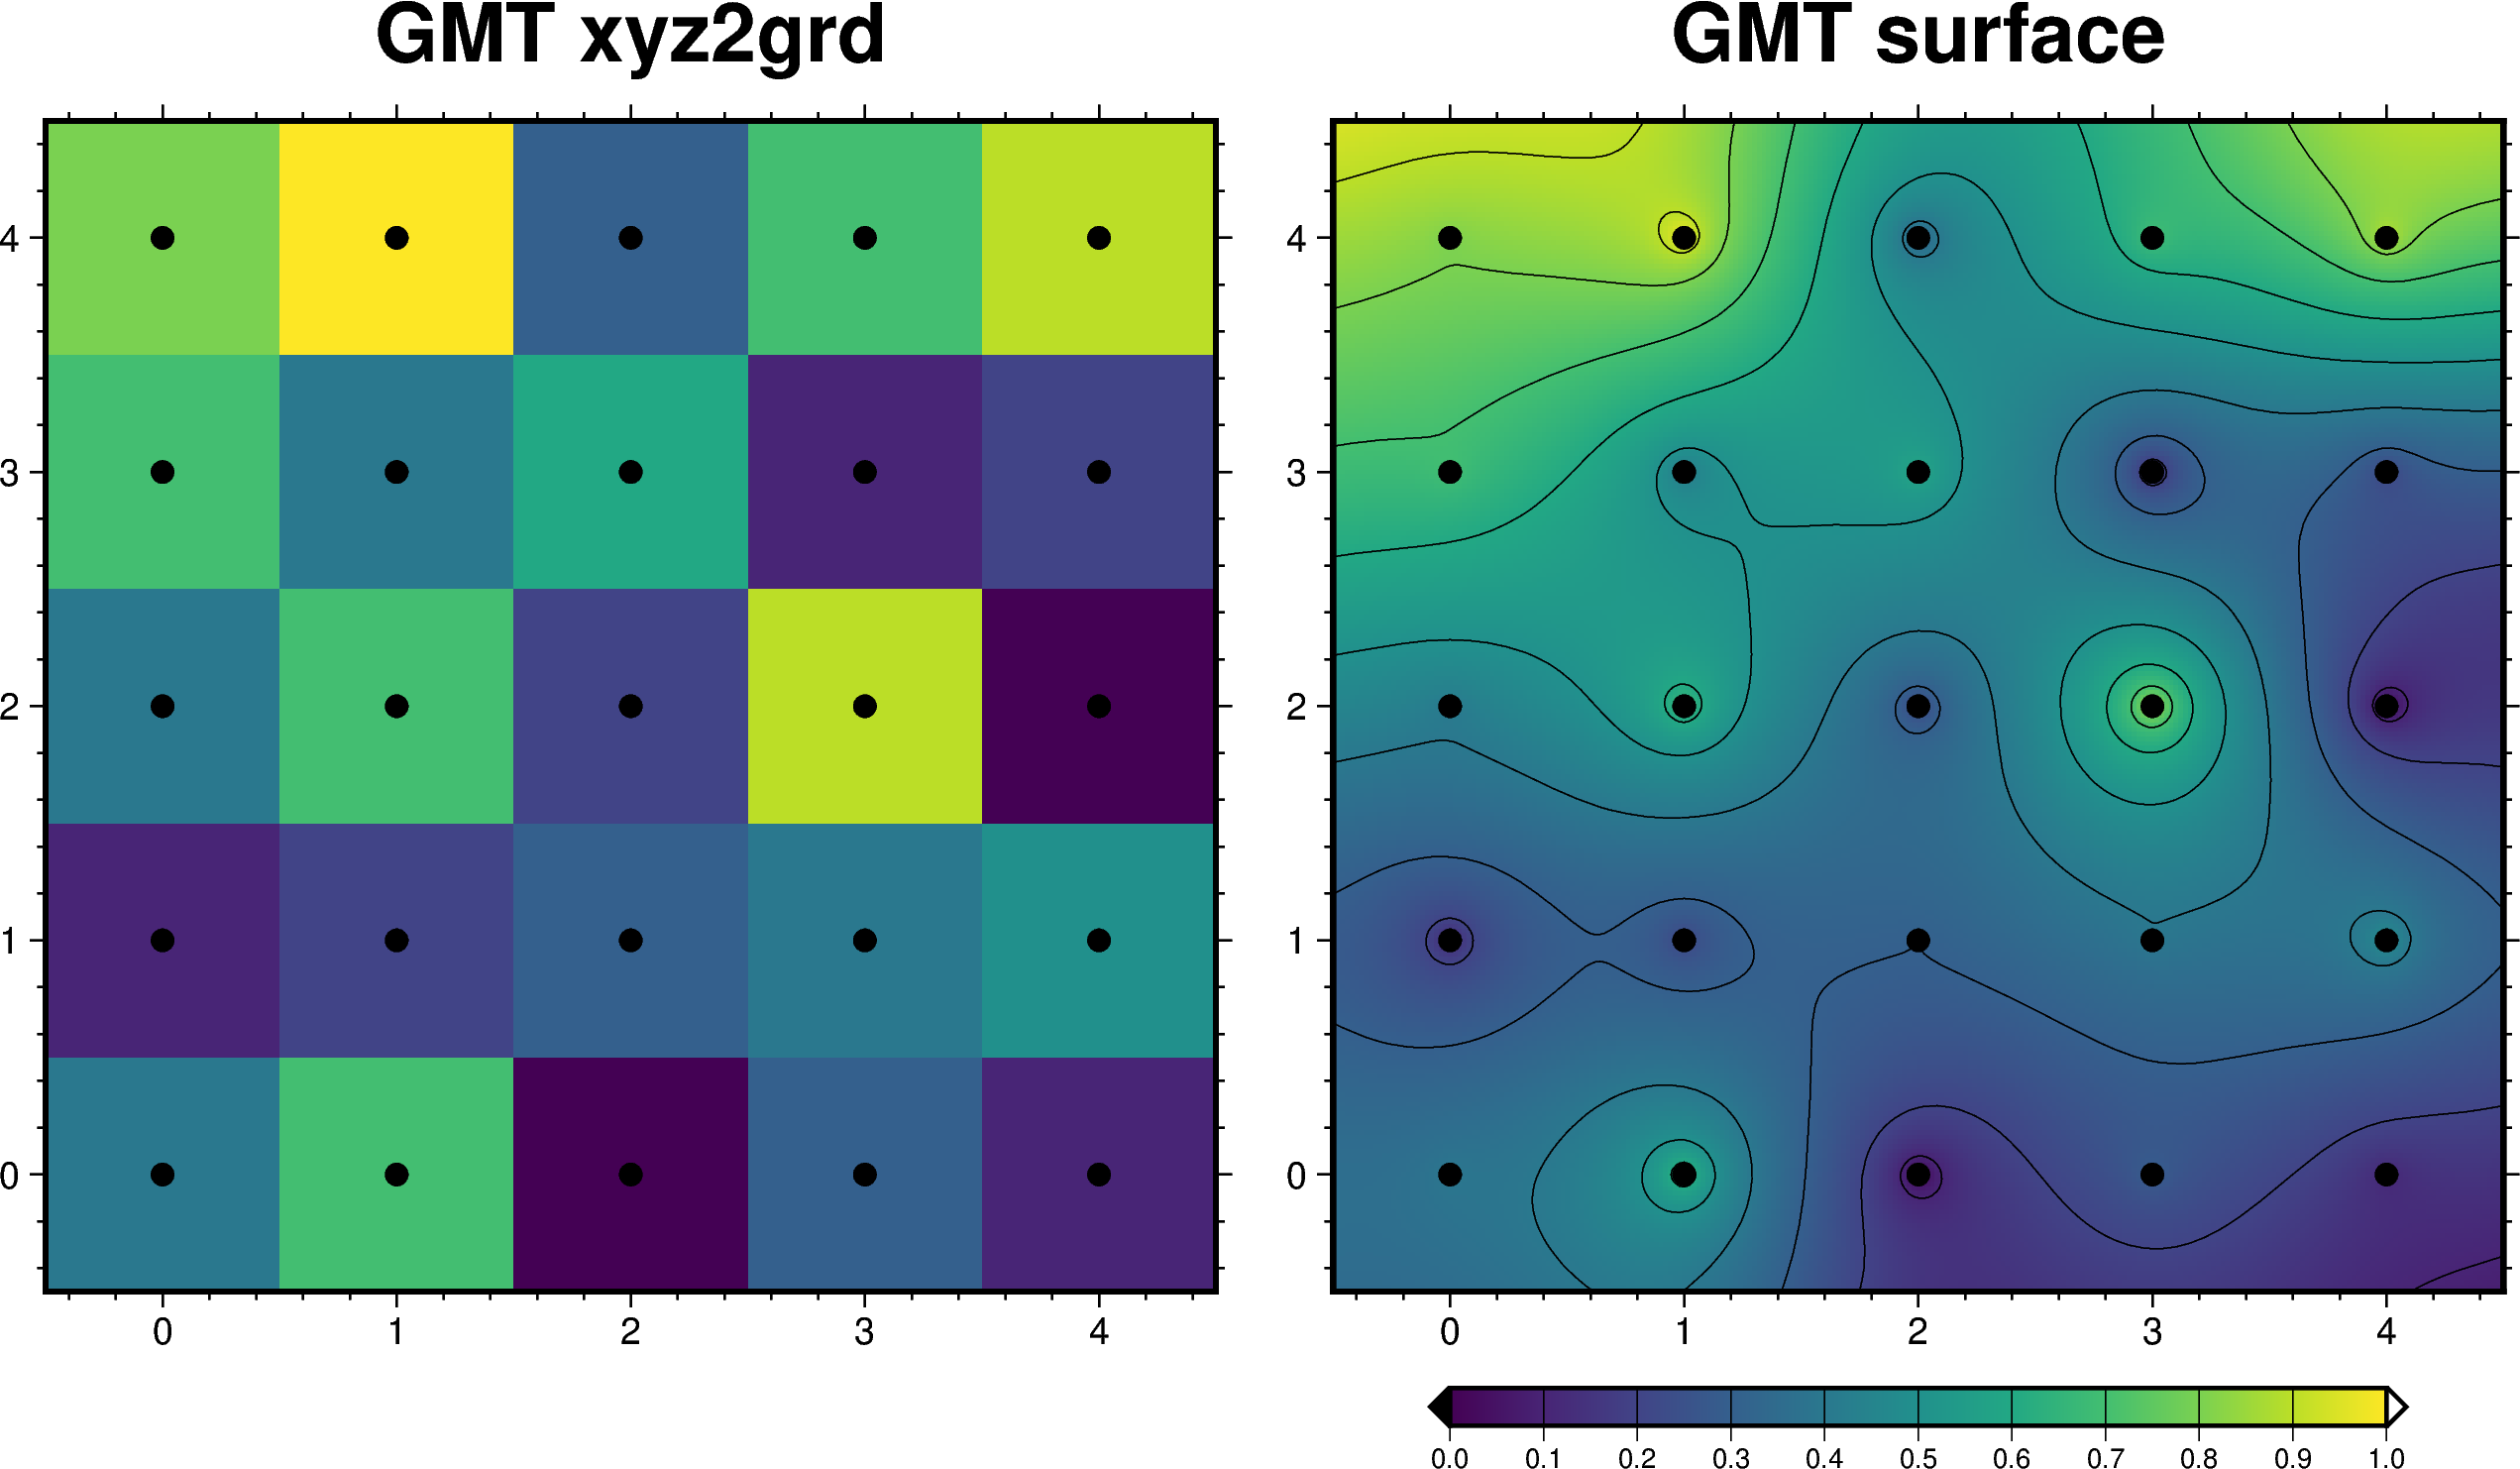
ここで作られたデータを ravel()メソッド1次元化し,pygmt.surfaceで補間をしてみます.比較のため pygmt.xyz2grd で粗い間隔のままのプロットも作成します.
fig = pygmt.Figure()

griddata_s = pygmt.surface(
    x       = mesh[0].ravel(),
    y       = mesh[1].ravel(),
    z       = data.ravel(),
    region  = [-0.5, 4.5, -0.5, 4.5],
    spacing = '0.02/0.02',
    tension = 0.5 # 無指定は0
)

griddata_x = pygmt.xyz2grd(
    x       = mesh[0].ravel(),
    y       = mesh[1].ravel(),
    z       = data.ravel(),
    region  = [-0.5, 4.5, -0.5, 4.5],
    spacing = '1/1',
    registration = 'p'
)


pygmt.makecpt(
    cmap = 'viridis',
    series = [0, 1, 0.1],
    continuous = True
)

fig.grdimage(
    grid = griddata_x,
    projection = 'X10c/10c',
    frame = ['WSen+tGMT xyz2grd', 'xaf', 'yaf'],
)

fig.plot(
    x = mesh[0].ravel(),
    y = mesh[1].ravel(),
    style = 'c0.2c',
    fill  = 'black',
)

# 右にずれる
fig.shift_origin( xshift = 11 )

fig.grdimage(
    grid = griddata_s,
    projection = 'X10c/10c',
    frame = ['WSen+tGMT surface', 'xaf', 'yaf']
)

fig.grdcontour(
    grid = griddata_s,
    pen = 'default,black',
    annotation = '-'
)

fig.plot(
    x = mesh[0].ravel(),
    y = mesh[1].ravel(),
    style = 'c0.2c',
    fill  = 'black',
)

fig.colorbar(
    position = '+e'
)

fig.show()
Note
pygmt.surface は tension factor \(t\) という量で補間の状況をコントロールします.その値を指定するオリジナルのGMTの -T オプションは,v0.8.0までが正式には実装されていませんでしたが, pygmt.surface{T = } とすると動作する状態でした.この T はオリジナルのGMTのsurfaceモジュールのオプション名です.
v0.9.0から公式に pygmt.surface に GMTのTオプションに相当するtensionオプションが実装されたようです.
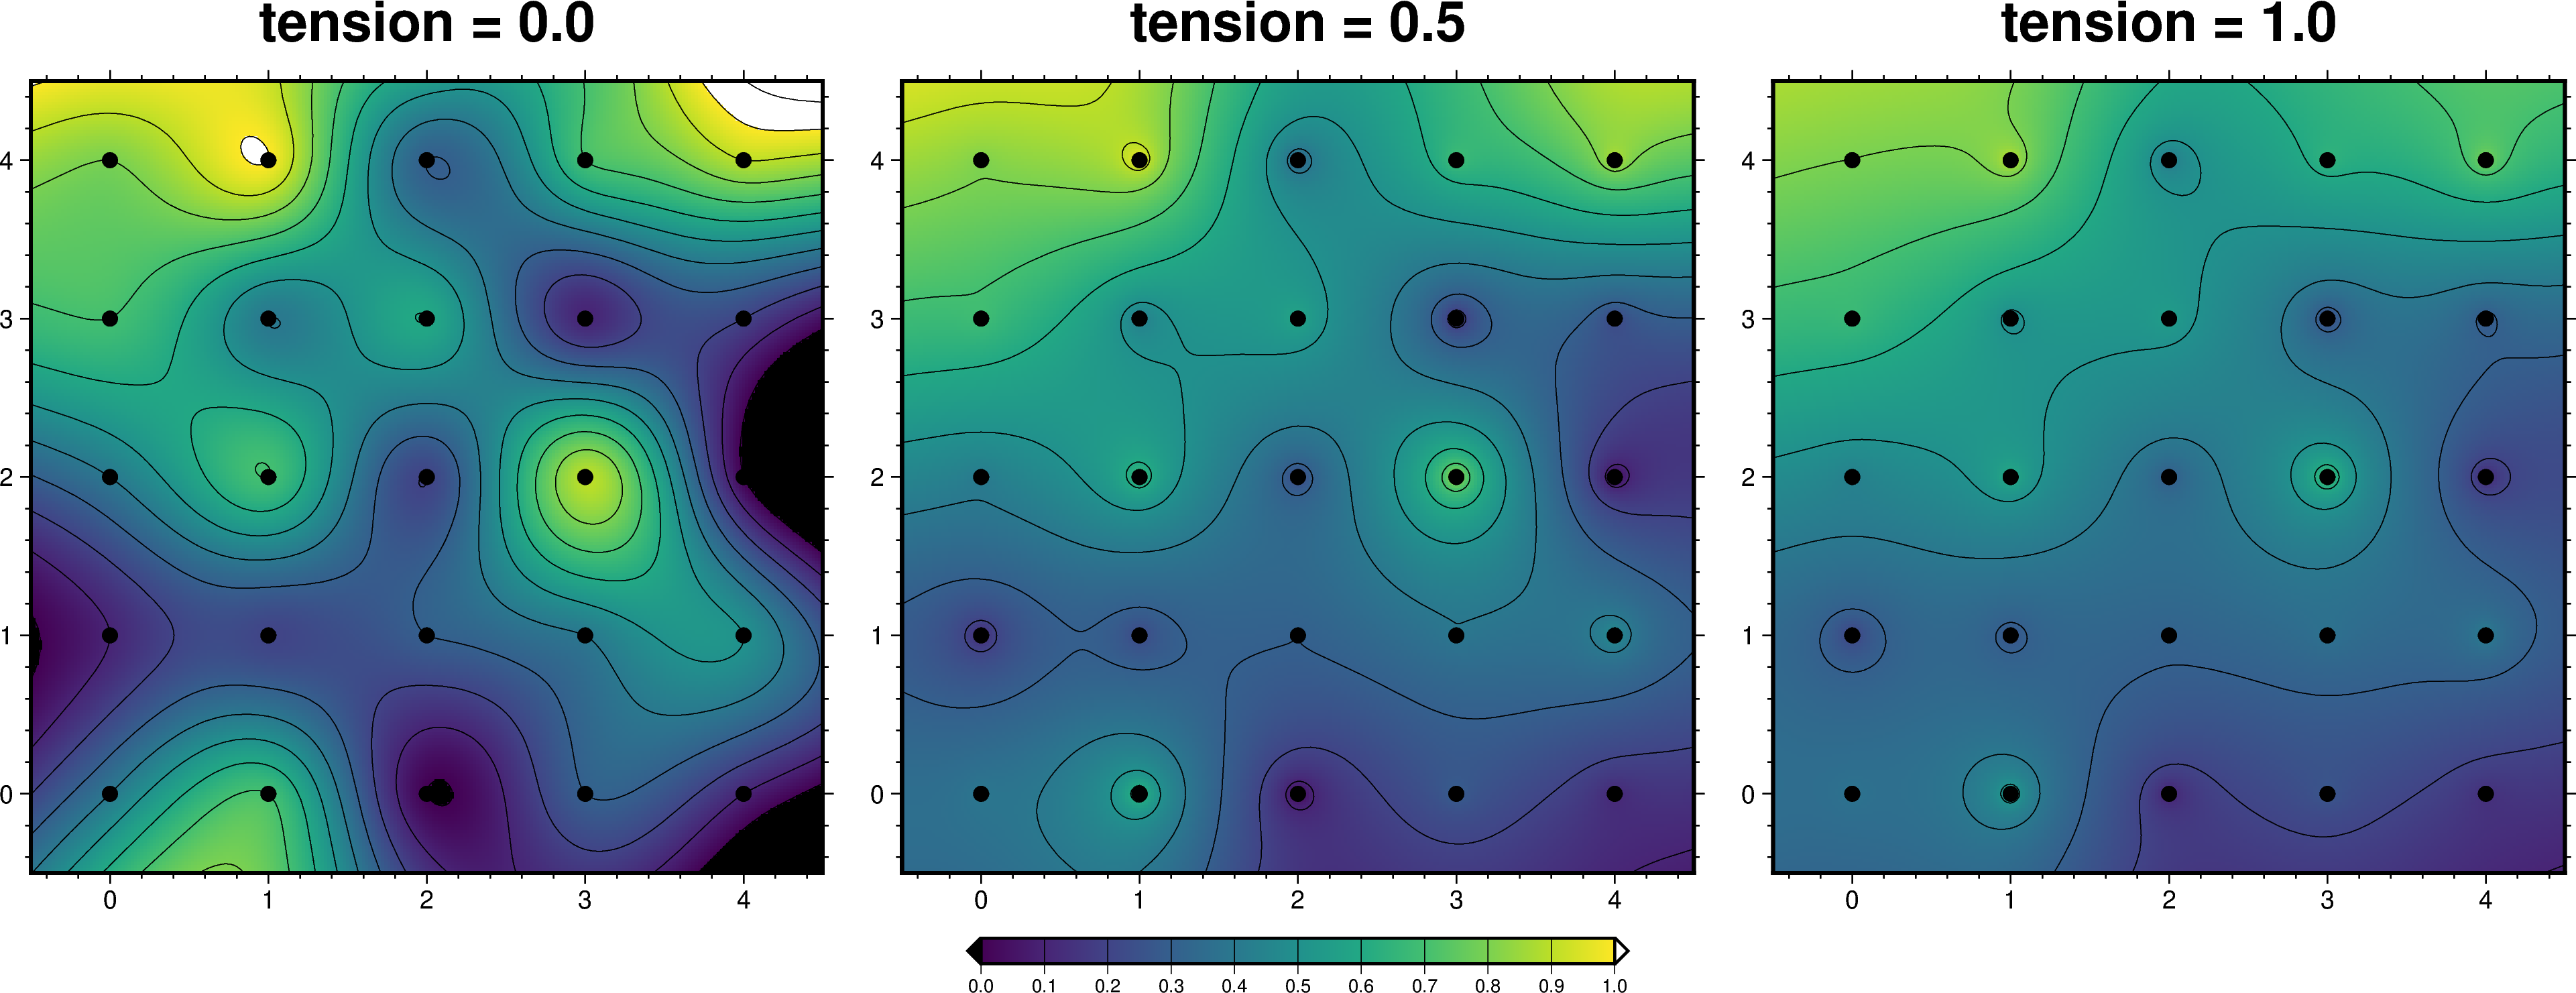
surfaceによる補間の挙動は,tensionパラメタによってだいぶ変わります.tensionを変えてみて,補間の違いを見てみましょう.
fig = pygmt.Figure()

pygmt.makecpt(
    cmap = 'viridis',
    series = [0, 1, 0.1],
    continuous = True
)

griddata_s0 = pygmt.surface(
    x       = mesh[0].ravel(),
    y       = mesh[1].ravel(),
    z       = data.ravel(),
    region  = [-0.5, 4.5, -0.5, 4.5],
    spacing = '0.02/0.02',
    tension = 0.0
)
griddata_s1 = pygmt.surface(
    x       = mesh[0].ravel(),
    y       = mesh[1].ravel(),
    z       = data.ravel(),
    region  = [-0.5, 4.5, -0.5, 4.5],
    spacing = '0.02/0.02',
    tension = 0.5
)
griddata_s2 = pygmt.surface(
    x       = mesh[0].ravel(),
    y       = mesh[1].ravel(),
    z       = data.ravel(),
    region  = [-0.5, 4.5, -0.5, 4.5],
    spacing = '0.02/0.02',
    tension = 1.0
)


fig.grdimage(
    grid = griddata_s0,
    projection = 'X10c/10c',
    frame = ['WSen+ttension = 0.0', 'xaf', 'yaf']
)

fig.grdcontour(
    grid = griddata_s0,
    pen = 'default,black',
    annotation = '-'
)

fig.plot(
    x = mesh[0].ravel(),
    y = mesh[1].ravel(),
    style = 'c0.2c',
    fill  = 'black',
)

# 右にずれる
fig.shift_origin( xshift = 11 )

fig.grdimage(
    grid = griddata_s1,
    projection = 'X10c/10c',
    frame = ['WSen+ttension = 0.5', 'xaf', 'yaf']
)

fig.grdcontour(
    grid = griddata_s1,
    pen = 'default,black',
    annotation = '-'
)

fig.plot(
    x = mesh[0].ravel(),
    y = mesh[1].ravel(),
    style = 'c0.2c',
    fill  = 'black',
)

fig.colorbar(
    position = '+e'
)

# 右にずれる
fig.shift_origin( xshift = 11 )


fig.grdimage(
    grid = griddata_s2,
    projection = 'X10c/10c',
    frame = ['WSen+ttension = 1.0', 'xaf', 'yaf']
)

fig.grdcontour(
    grid = griddata_s2,
    pen = 'default,black',
    annotation = '-'
)

fig.plot(
    x = mesh[0].ravel(),
    y = mesh[1].ravel(),
    style = 'c0.2c',
    fill  = 'black',
)

fig.show()
